News Releases
CUSTOMER PORTAL
-
搜索
Search
Synaptics Reports Second Quarter Fiscal 2022 Results
Q2’22 Financial Results and Recent Business Highlights
- Revenue of $420.5 million
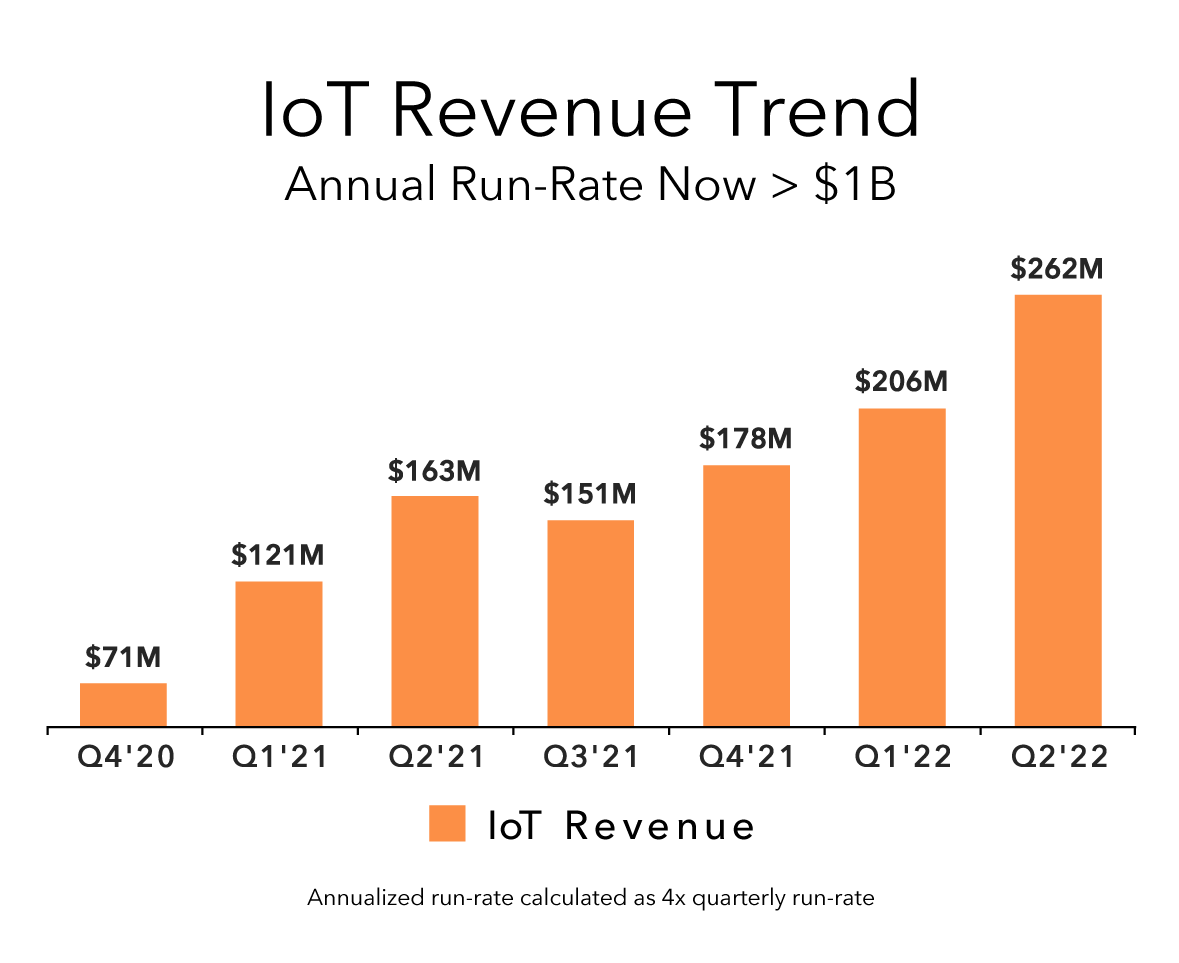
- IoT revenue increased 60% YoY
- Record GAAP gross margin of 53.5 percent
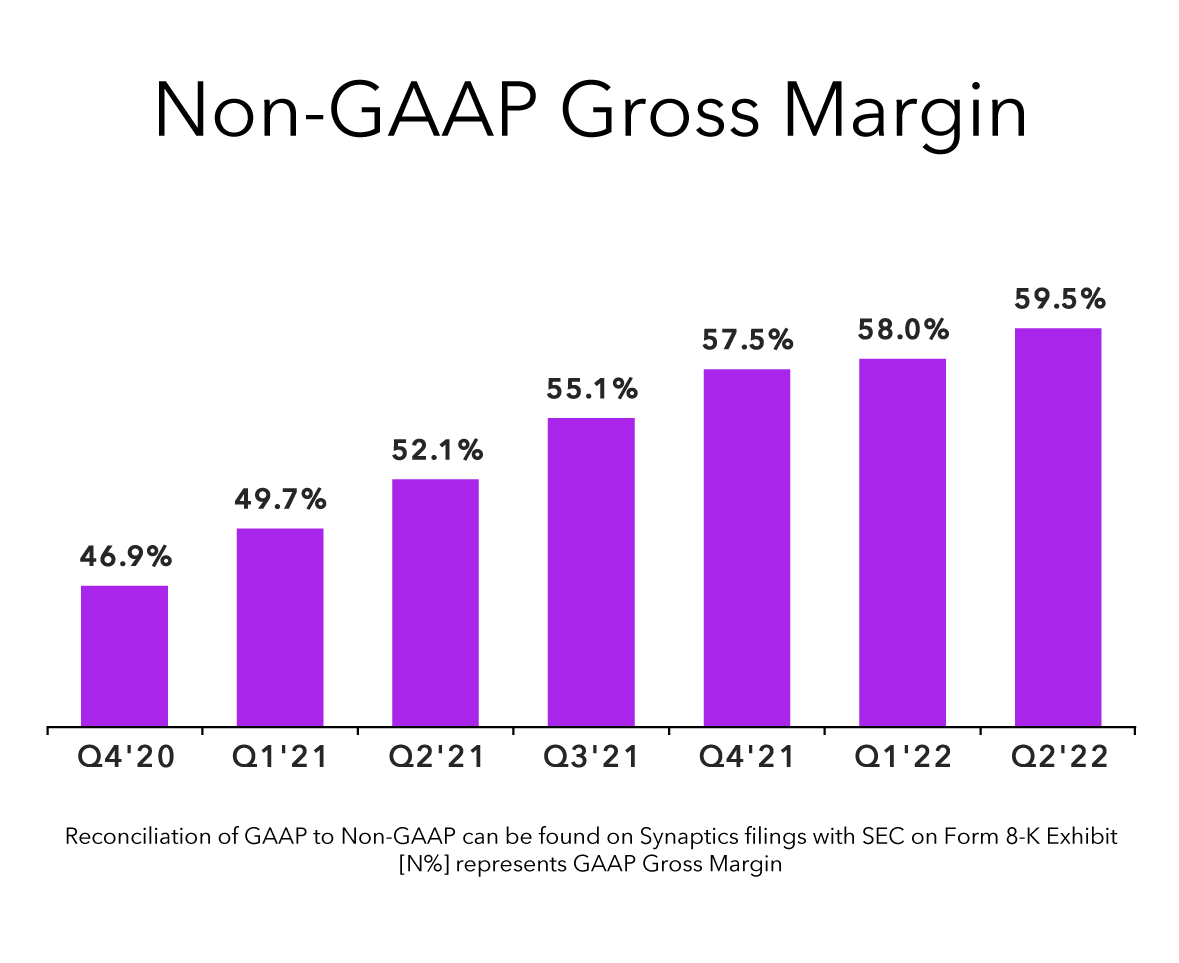
- Record non-GAAP gross margin of 59.5 percent
- GAAP diluted earnings per share of $1.71
- Record non-GAAP diluted earnings per share of $3.26
- GAAP operating margin of 18.5 percent
- Record non-GAAP operating margin of 37.1 percent
SAN JOSE, Calif., – Feb 03, 2022 – Synaptics Incorporated (Nasdaq: SYNA), today reported financial results for its second quarter of fiscal 2022 ended December 25, 2021.
Net revenue for the second quarter of fiscal 2022 was $420.5 million. GAAP net income for the second quarter of fiscal 2022 was $69.5 million, or $1.71 per diluted share. Non-GAAP net income for the second quarter of fiscal 2022 was a record $132.8 million, or $3.26 per diluted share.
“Synaptics reported another solid quarter with second quarter revenue at the mid-point of our guidance, non-GAAP gross margin at the high-end of our guidance and non-GAAP operating margin above the high-end of guidance. Our IoT revenue is now at a $1 billion annual run-rate and grew 60% year-over-year. Our pipeline and design-win momentum remains solid as we continue to deliver innovative solutions in each of our product groups.” said Michael Hurlston, Synaptics’ President and CEO.
Business Outlook
Dean Butler, Chief Financial Officer of Synaptics, added, “For our third quarter of fiscal year 2022, we expect to grow revenue again while maintaining our gross margin profile despite recent input price increases. Our mid-point guidance includes an expectation of achieving a significant non-GAAP gross margin milestone of 60%. Our backlog remains strong with customer demand continuing to outpace supply availability; we have once again factored in the current semiconductor supply chain constraints and pricing changes into our March quarter guidance.”
For the third quarter of fiscal 2022, the company expects:
| GAAP | Non-GAAP Adjustment | Non-GAAP | |
| Revenue | $450M to $480M | N/A | N/A |
| Gross Margin* | 52.5 percent to 53.5 percent | $32M | 59.5 percent to 60.5 percent |
| Operating Expense** | $159M to $166M | $55M to $58M | $104M to $108M |
*Projected Non-GAAP gross margin excludes $25 million of intangible asset amortization, $6 million of inventory fair value adjustments, and $1.0 million of share-based compensation.
**Projected Non-GAAP operating expense excludes $38 million to $41 million of share-based compensation, $2.5 million of prepaid development amortization, $2.5 million of restructuring costs, and $12 million of intangible asset amortization.
Earnings Call and Supplementary Materials
The Synaptics second quarter 2022 teleconference and webcast is scheduled to begin at 2:00 p.m. PT (5:00 p.m. ET), on Thursday, February 3, 2022, during which the company will provide forward-looking information.
Speakers:
- Michael Hurlston, President and Chief Executive Officer
- Dean Butler, Chief Financial Officer
To participate on the live call, analysts and investors should dial 833-614-1539 (conference ID: 4099047). Supplementary slides, a copy of the prepared remarks, and a live and archived webcast of the conference call will be accessible from the “Investor Relations” section of the company’s Website at https://investor.synaptics.com/.
Use of Non-GAAP Financial Information
In evaluating its business, Synaptics considers and uses Non-GAAP Net Income, which we define as net income excluding share-based compensation, acquisition related costs, and certain other non-cash or recurring and non-recurring items the company does not believe are indicative of its core operating performance as a supplemental measure of operating performance. Non-GAAP Net Income is not a measurement of the company’s financial performance under GAAP and should not be considered as an alternative to GAAP net income. The company presents Non-GAAP Net Income because it considers it an important supplemental measure of its performance since it facilitates operating performance comparisons from period to period by eliminating potential differences in net income caused by the existence and timing of share-based compensation charges, acquisition related costs, and certain other non-cash or recurring and non-recurring items. Non-GAAP Net Income has limitations as an analytical tool and should not be considered in isolation or as a substitute for the company’s GAAP net income. The principal limitations of this measure are that it does not reflect the company’s actual expenses and may thus have the effect of inflating its net income and net income per share as compared to its operating results reported under GAAP. In addition, the company presents components of Non-GAAP Net Income, such as Non-GAAP Gross Margin, Non-GAAP operating expenses and Non-GAAP operating margin, for similar reasons.
As presented in the “Reconciliation of GAAP Financial Measures to Non-GAAP Financial Measures” tables that follow, Non-GAAP Net Income and each of the other Non-GAAP financial measures excludes one or more of the following items:
Acquisition related costs
Acquisition related costs primarily consist of:
- amortization of purchased intangibles, which includes acquired intangibles such as developed technology, customer relationships, trademarks, backlog, licensed technology, patents, and in-process technology when post-acquisition development is determined to be substantively complete,
- inventory adjustments affecting the carrying value of inventory acquired in an acquisition,
- transitory post-acquisition incentive programs negotiated in connection with an acquired business or designed to encourage post-acquisition retention of key employees, and
- legal and consulting costs associated with acquisitions, including non-recurring post-acquisition costs and services.
These acquisition related costs are not factored into the company’s evaluation of its ongoing business operating performance or potential acquisitions, as they are not considered as part of the company’s principal operations. Further, the amount of these costs can vary significantly from period to period based on the terms of an earn-out arrangement, revisions to assumptions that went into developing the estimate of the contingent consideration associated with an earn-out arrangement, the size and timing of an acquisition, the lives assigned to the acquired intangible assets, and the maturity of the business acquired. Excluding acquisition related costs from Non-GAAP measures provides investors with a basis to compare Synaptics against the performance of other companies without the variability and potential earnings volatility associated with purchase accounting and acquisition related items.
Share-based compensation
Share-based compensation expense relates to employee equity award programs and the vesting of the underlying awards, which includes stock options, deferred stock units, market stock units, performance stock units, phantom stock units and the employee stock purchase plan. Share-based compensation settled with stock, which includes stock options, deferred stock units, market stock units, performance stock units and the employee stock purchase plan, is a non-cash expense, while share-based compensation settled with cash, which includes phantom stock units, is a cash expense. Settlement of all employee equity award programs whether settled with cash or stock varies in amount from period to period and is dependent on market forces that are often beyond the company’s control. As a result, the company excludes share-based compensation from its internal operating forecasts and models. The company believes that Non-GAAP measures reflecting adjustments for share-based compensation provide investors with a basis to compare the company’s principal operating performance against the performance of peer companies without the variability created by share-based compensation resulting from the variety of equity-linked compensatory awards used by other companies and the varying methodologies and assumptions used.
Amortization of prepaid development costs
Amortization of prepaid development costs represents the amortization of the estimated cost to develop certain future roadmap devices designed in advance process nodes in connection with an acquisition. The amortization of prepaid development costs represents a non-cash charge. As a result, the company excludes amortization of prepaid development costs from its internal operating forecasts and models when evaluating its ongoing business performance. The company believes that Non-GAAP measures reflecting adjustments for amortization of prepaid development costs provide investors with a basis to compare the company’s principal operating performance against the performance of other companies without the variability created by the amortization of prepaid development costs.
Restructuring costs
Restructuring costs consist primarily of employee severance and office closure costs, including the reversal of such costs. These costs are cash-based and designed to address cost structure inefficiencies. As a result, the company excludes restructuring costs from its internal operating forecasts and models when evaluating its ongoing business performance. The company believes that Non-GAAP measures reflecting adjustments for restructuring costs provide investors with a basis to compare the company’s principal operating performance against the performance of other companies without the variability created by restructuring costs designed to address cost structure inefficiencies in its business.
Other non-cash items
Other non-cash items include non-cash amortization of debt discount and issuance costs. These items are excluded from Non-GAAP results as they are non-cash. Excluding other non-cash items from Non-GAAP measures provides investors with a basis to compare Synaptics against the performance of other companies without the variability associated with other non-cash items.
Loss on extinguishment of debt
Loss on extinguishment of debt represents a non-cash item based on the difference in the carrying value of the debt and the fair value of the debt when extinguished. Loss on extinguishment of debt is excluded from Non-GAAP results as it is non-cash. Excluding loss on extinguishment of debt from Non-GAAP measures provides investors with a basis to compare Synaptics against the performance of other companies without the variability associated with loss on extinguishment of debt.
Equity investment loss
Equity investment loss represents an adjustment in the book value of an equity investment in a minority owned company. The equity investment loss is a non-cash item. As a result, the company excludes equity investment loss from its internal operating forecasts and models when evaluating its ongoing business performance. The company believes that Non-GAAP measures reflecting adjustments for equity investment loss provide investors with a basis to compare the company’s principal operating performance against the performance of other companies without the variability created by non-cash items.
Non-GAAP tax adjustments
The company forecasts its long-term Non-GAAP tax rate in order to provide investors with improved long-term modeling accuracy and consistency across financial reporting periods by eliminating the effects of certain items in our Non-GAAP net income and Non-GAAP net income per share, including the type and amount of share-based compensation, the taxation of post-acquisition intercompany intellectual property cross-licensing or transfer transactions, and the impact of other acquisition items that may or may not be tax deductible. The company intends to evaluate its long-term Non-GAAP tax rate annually for significant events, including material tax law changes in the major tax jurisdictions in which the company operates, corporate organizational changes related to acquisitions or tax planning opportunities, and substantive changes in our geographic earnings mix.
Forward-Looking Statements
This press release contains forward-looking statements that are subject to the safe harbors created under the Securities Act of 1933, as amended, and the Securities Exchange Act of 1934, as amended. Forward-looking statements give our current expectations and projections relating to our financial condition, results of operations, plans, objectives, future performance and business, including our expectations regarding the potential impacts on our business of the COVID-19 pandemic, and can be identified by the fact that they do not relate strictly to historical or current facts. Such forward-looking statements may include words such as “expect,” “anticipate,” “intend,” “believe,” “estimate,” “plan,” “target,” “strategy,” “continue,” “may,” “will,” “should,” variations of such words, or other words and terms of similar meaning. All forward-looking statements reflect our best judgment and are based on several factors relating to our operations and business environment, all of which are difficult to predict and many of which are beyond our control. Such factors include, but are not limited to, the risk that our business, results of operations and financial condition and prospects may be materially and adversely affected by the COVID-19 pandemic and that significant uncertainties remain related to the impact of COVID-19 on our business operations and future results, including our third quarter fiscal 2022 business outlook; global supply chain disruptions and component shortages that are currently affecting the semiconductor industry as a whole; the risks as identified in the “Risk Factors,” “Management’s Discussion and Analysis of Financial Condition and Results of Operations” and “Business” sections of our most recent Annual Report on Form 10-K and our most recent Quarterly Report on Form 10-Q (including that the impact of the COVID-19 pandemic may also exacerbate the risks discussed therein); and other risks as identified from time to time in our Securities and Exchange Commission reports. Forward-looking statements are based on information available to us on the date hereof, and we do not have, and expressly disclaim, any obligation to publicly release any updates or any changes in our expectations, or any change in events, conditions, or circumstances on which any forward-looking statement is based. Our actual results and the timing of certain events could differ materially from the forward-looking statements. These forward-looking statements do not reflect the potential impact of any mergers, acquisitions, or other business combinations that had not been completed as of the date of this release.
| SYNAPTICS INCORPORATED | |||||||||||
| CONSOLIDATED BALANCE SHEETS | |||||||||||
| (In millions except share data) | |||||||||||
| (Unaudited) | |||||||||||
| December 31, | June 30, | ||||||||||
| 2021 | 2021 | ||||||||||
| Assets | |||||||||||
| Current assets: | |||||||||||
| Cash and cash equivalents | $ | 502.8 | $ | 836.3 | |||||||
| Short-term investments | 71.1 | - | |||||||||
| Accounts receivables, net of allowances of $5.9 and $5.8 at | |||||||||||
| December 31, 2021 and June 30, 2021, respectively | 312.2 | 228.3 | |||||||||
| Inventories | 133.3 | 82.0 | |||||||||
| Prepaid expenses and other current assets | 55.3 | 33.1 | |||||||||
| Total current assets | 1,074.7 | 1,179.7 | |||||||||
| Property and equipment at cost, net | 56.9 | 91.2 | |||||||||
| Non-current assets held for sale | 50.8 | - | |||||||||
| Goodwill | 826.6 | 570.0 | |||||||||
| Purchased intangibles, net | 447.6 | 301.5 | |||||||||
| Non-current other assets | 110.8 | 84.4 | |||||||||
| Total assets | $ | 2,567.4 | $ | 2,226.8 | |||||||
| 0.00 | 0.00 | ||||||||||
| Liabilities and stockholders' equity | |||||||||||
| Current liabilities: | |||||||||||
| Accounts payable | $ | 134.5 | $ | 97.6 | |||||||
| Accrued compensation | 68.4 | 76.4 | |||||||||
| Income taxes payable | 23.8 | 29.4 | |||||||||
| Other accrued liabilities | 138.5 | 96.2 | |||||||||
| Current portion of debt | - | 487.1 | |||||||||
| Total current liabilities | 365.2 | 786.7 | |||||||||
| Long-term debt | 983.5 | 394.4 | |||||||||
| Other long-term liabilities | 154.8 | 78.5 | |||||||||
| Total liabilities | 1,503.5 | 1,259.6 | |||||||||
| Commitments and contingencies | |||||||||||
| Stockholders' equity: | |||||||||||
| Preferred stock; | |||||||||||
| $.001 par value; 10,000,000 shares authorized; | |||||||||||
| no shares issued and outstanding | - | - | |||||||||
| Common stock; | |||||||||||
| $.001 par value; 120,000,000 shares authorized; | |||||||||||
| 67,643,668 and 66,963,006 shares issued, and 39,519,047 and | |||||||||||
| 35,331,903 shares outstanding, respectively | 0.1 | 0.1 | |||||||||
| Additional paid in capital | 867.7 | 1,391.5 | |||||||||
| Less: 28,124,621 and 31,631,103 treasury shares, at cost | (694.5 | ) | (1,205.4 | ) | |||||||
| Accumulated other comprehensive income | (0.1 | ) | - | ||||||||
| Retained earnings | 890.7 | 781.0 | |||||||||
| Total stockholders' equity | 1,063.9 | 967.2 | |||||||||
| Total liabilities and stockholders' equity | $ | 2,567.4 | $ | 2,226.8 | |||||||
| SYNAPTICS INCORPORATED | |||||||||||||||||||
| CONDENSED CONSOLIDATED STATEMENTS OF OPERATIONS | |||||||||||||||||||
| (In millions except per share data) | |||||||||||||||||||
| (Unaudited) | |||||||||||||||||||
| Three Months Ended | Six Months Ended | ||||||||||||||||||
| December 31, | December 31, | ||||||||||||||||||
| 2021 | 2020 | 2021 | 2020 | ||||||||||||||||
| Net revenue | $ | 420.5 | $ | 357.6 | $ | 793.2 | $ | 686.0 | |||||||||||
| Acquisition related costs (1) | 24.0 | 34.8 | 40.9 | 63.3 | |||||||||||||||
| Cost of revenue | 171.4 | 172.4 | 329.1 | 337.8 | |||||||||||||||
| Gross margin | 225.1 | 150.4 | 423.2 | 284.9 | |||||||||||||||
| Operating expenses | |||||||||||||||||||
| Research and development | 88.9 | 77.3 | 175.0 | 158.2 | |||||||||||||||
| Selling, general, and administrative | 44.3 | 39.5 | 85.9 | 74.8 | |||||||||||||||
| Acquisition related costs (2) | 9.2 | 8.7 | 17.6 | 15.4 | |||||||||||||||
| Restructuring costs (3) | 5.1 | 0.6 | 6.5 | 6.2 | |||||||||||||||
| Gain on sale of audio technology assets | - | (34.2 | ) | - | (34.2 | ) | |||||||||||||
| Total operating expenses | 147.5 | 91.9 | 285.0 | 220.4 | |||||||||||||||
| Operating income | 77.6 | 58.5 | 138.2 | 64.5 | |||||||||||||||
| Interest and other income, net | (5.7 | ) | (6.0 | ) | (11.6 | ) | (10.7 | ) | |||||||||||
| Loss on early retirement of debt | - | - | (8.1 | ) | - | ||||||||||||||
| Income before income taxes | 71.9 | 52.5 | 118.5 | 53.8 | |||||||||||||||
| Provision for income taxes | 2.0 | 2.4 | 7.9 | 6.0 | |||||||||||||||
| Equity investment loss | (0.4 | ) | (0.5 | ) | (0.9 | ) | (1.0 | ) | |||||||||||
| Net income | $ | 69.5 | $ | 49.6 | $ | 109.7 | $ | 46.8 | |||||||||||
| Net income per share: | |||||||||||||||||||
| Basic | $ | 1.76 | $ | 1.43 | $ | 2.85 | $ | 1.36 | |||||||||||
| Diluted | $ | 1.71 | $ | 1.36 | $ | 2.70 | $ | 1.29 | |||||||||||
| Shares used in computing net income per share: | |||||||||||||||||||
| Basic | 39.4 | 34.8 | 38.5 | 34.5 | |||||||||||||||
| Diluted | 40.7 | 36.5 | 40.7 | 36.4 | |||||||||||||||
| (1 | ) | These acquisition related costs consist primarily of amortization of acquired intangible | |||||||||||||||||
| assets and inventory fair value adjustments associated with acquisitions. | |||||||||||||||||||
| (2 | ) | These acquisition related costs, net consist primarily of amortization associated with certain | |||||||||||||||||
| acquired intangible assets. | |||||||||||||||||||
| (3 | ) | Restructuring costs primarily include severance costs and facility consolidation | |||||||||||||||||
| costs associated with operational restructurings and acquisitions. | |||||||||||||||||||
| SYNAPTICS INCORPORATED | ||||||||||||||||||
| Reconciliation of GAAP Financial Measures to Non-GAAP Financial Measures | ||||||||||||||||||
| (In millions except per share data) | ||||||||||||||||||
| (Unaudited) | ||||||||||||||||||
| Three Months Ended | Six Months Ended | |||||||||||||||||
| December 31, | December 31, | |||||||||||||||||
| 2021 | 2020 | 2021 | 2020 | |||||||||||||||
| GAAP gross margin | $ | 225.1 | $ | 150.4 | $ | 423.2 | $ | 284.9 | ||||||||||
| Acquisition related costs | 24.0 | 34.8 | 40.9 | 63.3 | ||||||||||||||
| Recovery on supply commitment | - | - | - | (0.6 | ) | |||||||||||||
| Share-based compensation | 1.3 | 1.0 | 2.3 | 1.8 | ||||||||||||||
| Non-GAAP gross margin | $ | 250.4 | $ | 186.2 | $ | 466.4 | $ | 349.4 | ||||||||||
| GAAP gross margin - percentage of revenue | 53.5 | % | 42.1 | % | 53.4 | % | 41.5 | % | ||||||||||
| Acquisition related costs - percentage of revenue | 5.7 | % | 9.7 | % | 5.2 | % | 9.2 | % | ||||||||||
| Recovery on supply commitment | 0.0 | % | 0.0 | % | 0.0 | % | -0.1 | % | ||||||||||
| Share-based compensation - percentage of revenue | 0.3 | % | 0.3 | % | 0.3 | % | 0.3 | % | ||||||||||
| Non-GAAP gross margin - percentage of revenue | 59.5 | % | 52.1 | % | 58.8 | % | 50.9 | % | ||||||||||
| GAAP research and development expense | $ | 88.9 | $ | 77.3 | $ | 175.0 | $ | 158.2 | ||||||||||
| Share-based compensation | (18.6 | ) | (9.5 | ) | (39.4 | ) | (20.5 | ) | ||||||||||
| Retention costs | - | (1.0 | ) | - | (3.9 | ) | ||||||||||||
| Amortization prepaid development costs | (2.5 | ) | (2.5 | ) | (5.0 | ) | (4.2 | ) | ||||||||||
| Integration related costs | - | (0.2 | ) | - | (0.9 | ) | ||||||||||||
| Non-GAAP research and development expense | $ | 67.8 | $ | 64.1 | $ | 130.6 | $ | 128.7 | ||||||||||
| GAAP selling, general, and administrative expense | $ | 44.3 | $ | 39.5 | $ | 85.9 | $ | 74.8 | ||||||||||
| Share-based compensation | (16.7 | ) | (12.9 | ) | (30.5 | ) | (22.6 | ) | ||||||||||
| Acquisition/divestiture related costs | (1.2 | ) | (0.7 | ) | (3.4 | ) | (2.4 | ) | ||||||||||
| Retention costs | - | (0.1 | ) | - | (1.1 | ) | ||||||||||||
| Non-GAAP selling, general, and administrative expense | $ | 26.4 | $ | 25.8 | $ | 52.0 | $ | 48.7 | ||||||||||
| GAAP operating income | $ | 77.6 | $ | 58.5 | $ | 138.2 | $ | 64.5 | ||||||||||
| Recovery on supply commitment | - | - | - | (0.6 | ) | |||||||||||||
| Acquisition & integration related costs | 34.4 | 44.4 | 61.9 | 82.0 | ||||||||||||||
| Share-based compensation | 36.6 | 23.4 | 72.2 | 44.9 | ||||||||||||||
| Restructuring costs | 5.1 | 0.6 | 6.5 | 6.2 | ||||||||||||||
| Retention costs | - | 1.1 | - | 5.0 | ||||||||||||||
| Amortization prepaid development costs | 2.5 | 2.5 | 5.0 | 4.2 | ||||||||||||||
| Gain on sale of audio technology assets | - | (34.2 | ) | - | (34.2 | ) | ||||||||||||
| Non-GAAP operating income | $ | 156.2 | $ | 96.3 | $ | 283.8 | $ | 172.0 | ||||||||||
| GAAP net income | $ | 69.5 | $ | 49.6 | $ | 109.7 | $ | 46.8 | ||||||||||
| Recovery on supply commitment | - | - | - | (0.6 | ) | |||||||||||||
| Acquisition & integration related costs | 34.4 | 44.4 | 61.9 | 82.0 | ||||||||||||||
| Share-based compensation | 36.6 | 23.4 | 72.2 | 44.9 | ||||||||||||||
| Restructuring costs | 5.1 | 0.6 | 6.5 | 6.2 | ||||||||||||||
| Retention program costs | - | 1.1 | - | 5.0 | ||||||||||||||
| Amortization prepaid development costs | 2.5 | 2.5 | 5.0 | 4.2 | ||||||||||||||
| Gain on sale of audio technology assets | - | (34.2 | ) | - | (34.2 | ) | ||||||||||||
| Other non-cash items | 0.4 | 4.9 | 2.2 | 9.7 | ||||||||||||||
| Loss on extinguishment of debt | - | - | 8.1 | - | ||||||||||||||
| Equity investment loss | 0.4 | 0.5 | 0.9 | 1.0 | ||||||||||||||
| Non-GAAP tax adjustments | (16.1 | ) | (9.0 | ) | (25.0 | ) | (14.5 | ) | ||||||||||
| Non-GAAP net income | $ | 132.8 | $ | 83.8 | $ | 241.5 | $ | 150.5 | ||||||||||
| GAAP net income per share - diluted | $ | 1.71 | $ | 1.36 | $ | 2.70 | $ | 1.29 | ||||||||||
| Recovery on supply commitment | - | - | - | (0.02 | ) | |||||||||||||
| Acquisition/divestiture & integration related costs | 0.84 | 1.22 | 1.52 | 2.25 | ||||||||||||||
| Share-based compensation | 0.90 | 0.64 | 1.78 | 1.23 | ||||||||||||||
| Restructuring costs | 0.13 | 0.02 | 0.16 | 0.17 | ||||||||||||||
| Retention program costs | - | 0.03 | - | 0.14 | ||||||||||||||
| Amortization prepaid development costs | 0.06 | 0.07 | 0.12 | 0.11 | ||||||||||||||
| Gain on sale of audio technology assets | - | (0.94 | ) | - | (0.94 | ) | ||||||||||||
| Other non-cash items | 0.01 | 0.14 | 0.05 | 0.27 | ||||||||||||||
| Loss on extinguishment of debt | - | - | 0.20 | - | ||||||||||||||
| Equity investment loss | 0.01 | 0.01 | 0.02 | 0.03 | ||||||||||||||
| Non-GAAP tax adjustments | (0.40 | ) | (0.25 | ) | (0.62 | ) | (0.40 | ) | ||||||||||
| Non-GAAP net income per share - diluted | $ | 3.26 | $ | 2.30 | $ | 5.93 | $ | 4.13 | ||||||||||
| SYNAPTICS INCORPORATED | ||||||||
| CONDENSED CONSOLIDATED CASH FLOWS | ||||||||
| (In millions) | ||||||||
| (Unaudited) | ||||||||
| Six Months Ended | ||||||||
| December 31, | ||||||||
| 2021 | 2020 | |||||||
| Net income | $ | 109.7 | $ | 46.8 | ||||
| Non-cash operating items | 123.8 | 75.2 | ||||||
| Changes in working capital | (52.8 | ) | (44.1 | ) | ||||
| Provided by operations | 180.7 | 77.9 | ||||||
| Acquisitions & investments | (512.2 | ) | (628.0 | ) | ||||
| Gain on sale of audio technology assets | - | 34.2 | ||||||
| Fixed asset & intangible asset purchases | (13.2 | ) | (12.2 | ) | ||||
| Proceeds from maturities of short-term investments | 0.6 | 88.0 | ||||||
| Used in investing | (524.8 | ) | (518.0 | ) | ||||
| Payment for redemption of convertible debt | (505.6 | ) | - | |||||
| Issuance of debt, net of issuance costs | 588.8 | - | ||||||
| Equity compensation, net | (54.9 | ) | (14.6 | ) | ||||
| Refundable deposit transferred to vendor | (16.6 | ) | - | |||||
| Provided by/(used in) financing | 11.7 | (14.6 | ) | |||||
| Effect of exchange rate changes on cash and cash equivalents | (1.1 | ) | 1.2 | |||||
| Net change in cash and cash equivalents | (333.5 | ) | (453.5 | ) | ||||
| Cash and cash equivalents at beginning of period | 836.3 | 763.4 | ||||||
| Cash and cash equivalents at end of period | $ | 502.8 | $ | 309.9 | ||||
| Cash paid for taxes | $ | 17.4 | $ | 27.1 | ||||
| Cash refund on taxes | $ | 1.6 | $ | 0.3 | ||||
关于突触
突触(纳斯达克市场代码: SYNA )开创了人与人之间的关系。智能设备,为高端市场带来创新和直观的用户体验。 Synaptics广泛的触摸,显示,生物识别,语音,视频,视觉,人工智能,音频和连接产品组合建立在公司丰富的研发,广泛的IP和可靠的供应链功能之上。通过为智能家居,智能手机,PC和外围设备以及汽车市场设计的解决方案,Synaptics结合了易用性,功能性和美观性,从而使产品能够使我们的数字生活更加高效,安全和愉悦。
在 LinkedIn , Twitter ,和 Facebook ,或访问 www.synaptics.com 。
有关公共关系,请联系:
投资者关系,请联系: